Your Task
Apply forecasting techniques to a given dataset and provide a business application of the forecasts. The assessment is worth 30 marks (see rubric for allocation of these marks).
Assessment Description
The data provided for the assessment are time series of monthly sales revenue for two stores: TheDon which sells cricket equipment; and Work Out which sells equipment for a wide range of sports.’
The objective of the assessment is to use Exploratory, Tableau and Excel software to: describe the time series; to develop Prophet and Holt-Winters demand forecast models for the two stores; and to compare forecasts from these models.
Assessment Instructions
In class: You will be presented with a dataset in class. As a group, analyse the dataset using Tableau and Exploratory.io.
You will provide an oral presentation of the group work in parts A to D during the third hour of the workshop.
The data set will be posted or emailed to you at the beginning of class in Week 5. After Class: Individually write a 500-word report, which briefly summarises the analysis and provides suggestions for further analysis. This component of the assessment is to be submitted via Turnitin, within 48 hours of midnight on the day of your class in Week 5.
No marks will be awarded for the assessment unless this report is submitted. Hint: take notes during the group assessment to use as prompts for your report.
As a group:
Part A
– Use Tableau to compare time series plots for the two stores by: plotting one under the other; and by plotting both on the same graph. Explain how you implement these plots in Tableau. – Comment on features of the two time series. Use descriptive analytics to compare the two stores in terms of sales revenue, and explain how these statistics can be obtained using Tableau.
Part B
– Use Tableau to investigate trend and seasonal variability in the time series for the two stores. Explain how to implement relevant graphics in Tableau. Comment on the trends and seasonal effects.
Part C
– Use Tableau to obtain Holt-Winters forecasts for TheDon for the next 12 months, and to provide a suitable graphical display. Explain the various summaries provided by Tableau, in the context of TheDon. Explain how to find the point forecast three months ahead and its 95% Prediction Interval in Tableau.
Part D
– Use Exploratory to obtain Prophet forecasts for TheDon for the next 12 months, and to provide a suitable graphical display. Explain the various summaries provided by Exploratory, in the context of TheDon. Explain how to find the point forecast three months ahead and its 95% Prediction Interval in Exploratory.
Part E
Prepare a PowerPoint presentation with your answers to A, B, C, and D:
• Include screenshots showing how you use the software, and of the information provided by the software.
• Discuss the suitability of HW and Prophet forecasting for TheDon.
Note: All members of the group should be involved in the presentation. The allocated time for the presentation will be decided by your lecturer.
As individuals:
Take the most recent year as a test series. Use the time series, less the final year, as a training series.
• a) Plot training series plus HW forecasts for test year for TheDon in Tableau. • b) Plot training series plus Prophet forecasts for test year for TheDon in Exploratory. • c) Selecting from statistics given in Tableau and Exploratory, construct a table of RMSE within training series by method by store.
• d) Make calculations in Excel, or otherwise, construct a table of RMSE in the test series by method by store.
• e) Explain why the RMSE is expected to be larger in the test series. Will the RMSE necessarily be larger in the test series?
• f) Make calculations in Excel, or otherwise, find the MASE using Prophet in the test series for WorkOut.
Note: You must submit your individual report before midnight on the second day after your class in Week 5
Important Study Information
Academic Integrity Policy
KBS values academic integrity. All students must understand the meaning and consequences of cheating, plagiarism and other academic offences under the Academic Integrity and Conduct Policy.
What is academic integrity and misconduct?
What are the penalties for academic misconduct?
What are the late penalties?
How can I appeal my grade?
Word Limits for Written Assessments
Submissions that exceed the word limit by more than 10% will cease to be marked from the point at which that limit is exceeded.
Study Assistance
Students may seek study assistance from their local Academic Learning Advisor or refer to the resources on the MyKBS Academic Success Centre page. Click here for this information.
Late assignment submission penalties
Penalties will be imposed on late assignment submissions in accordance with Kaplan Business School’s Assessment Policy.
Page 4 Kaplan Business School Assessment Outline
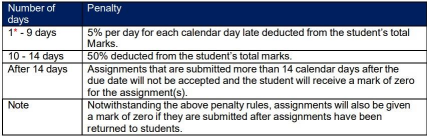
*Assignments submitted at any stage within the first 24 hours after deadline will be considered to be one day late and therefore subject to the associated penalty.
If you are unable to complete this assessment by the due date/time, please refer to the Special Consideration Application Form, which is available at the end of the KBS Assessment Policy: https://www.kbs.edu.au/wp
content/uploads/2016/07/KBS_FORM_AssessmentPolicy_MAR2018_FA.pdf
Generative AI Traffic Lights
Please see the level of Generative AI that this assessment has been designed to accept:
Assessment Marking Guide
Leave A Comment