Get Best Data Driven Decisions for Business Assignment Help For BPP University London!!!
Task 1. Introduction and project plan
As a data analyst from the Wood from the Trees (WFTT) company who has been hired for the job. This consulting firm was successful in building a global reputation. New hires with little experience have been offered several opportunities by WFTT, and they have also received development help from a consultant. With the help of their in-depth knowledge and comprehension, WFTT were able to perform the many tasks assigned to them by the data analysis for this research and gather data to support their sound judgement. Data analysis, along with its problems and solutions, will be covered in the assignment. Task 3 will discuss BIJ success from the BIJ dataset as well as operation performance in the research. Comparing market category performance and the effects of marketing campaigns on the British Market are covered in table 4 of the research (Payne et al., 2018).
Asia, North America, and Europe are the three continents on which Bangles and International Jewellery (BIJ) works in a variety of national markets. Africa, South America, and Australasia are the only regions where it is not now operational. BIJ wants to compete with businesses like Signet, LVMH, and Cartier despite being much smaller. A small number of BIJ’s hallmark storefronts may be found in New York, London, and Mumbai in addition to selling throughout a network of distributors. In significant airport hubs, it also owns concessions (Sharma et al., 2022). The WFTT project contains a data analysis strategy that includes benchmark comparisons between sales volume as well as quarter volume of group performance as well as sales volume for the month, year, and overall analysis period. A brief discussion of Task 4 will be provided, based on the data charts, to provide the skills for interpreting the data and creating a visual presentation. By comparing valuation based on industry value, comparing category performance across markets, and assessing the influence of market campaigns on the UK market, assessments of skills for advancement purposes have been carried out. Data from the BIJ in the United Kingdom were considered in the data analysis. The information was gathered in preparation for 2020 data. The BIJ market of the United Kingdom’s sales volume and value have been incorporated into the project design. Jewellery manufacturer Bangles International makes bracelets, rings, and necklaces. Data discussion has been addressed with the analysis of BIJ premised on other highlighter values. Analysis of the data of BIJ has created the extensive market value of jewellery. In this project, a graph chart has been used to illustrate KPI. Performance of the key performance indicator includes a survey of BIJ for the periods 2018, 2019, and 2020. The assumption of key performance indicators’ potential future influence on BIJ has been measured. The institution’s KPI strategy is essential to the success of the business since without measuring KPI performance, BIJ data analysis would not be complete (Chodak et al., 2021).
Task 2. Data quality issues and remedies
2.1 Data quality issues
The study has taken into account the revenue and inaccurate data sources issues. In order to strengthen entire data analysis and prevent mistakes from being made again, this section makes some advice about data quality concerns. A few common data errors have been mentioned in the assignment. On the broader financial structure, nevertheless, it has a good long impact.
2.2 Repetition of data
If the original data is used in a data analysis process more than once, storage issues and technological errors have been created. When a comparison was made, it must have been engaging in misbehavior. To establish a future innovation plan, comparability measurement has been conducted. Repeating data is required to provide inadvertent information.
2.3 Unstructured data
This particular structure was used when creating the database. In the absence of a certain variable, overall structure can only alter; otherwise, no modifications have been performed. Without sufficient data, if the structure of the data analysis is altered, the results might be meaningless. Unstructured data has always been a source of concern in this location.
2.4 Misguide with wrong data set
For the accepted assumption plan for extensive data sources, historical data has been collected. Though it was proven that the incorrect dataset had not offered any useful information, it was unable to deliver a compelling report.
2.5 Data quality issues of BIJ
Numerous errors were committed by BIJ throughout the data analysis. With incorrect data from the prior year, the data analysis was done. Thus, the measurement now contains a miscalculated profits component that lowers the value of sales. The geographical region of the data makes the entry of misbehavior data difficult. The profit price for 2018 has been decreased by a data analyst. Sales values have decreased throughout the year as a result. Finding data quality concerns and significant business difficulties is made easier with the use of yearly data from the prior year.
2.6 Recommendation of data quality issues
A data analyst must ensure that the data elements are taken from the BIJ annual report in order to prevent problems with data quality. The business should implement a database-based cyber security approach. When a business is involved in the production of several different items, it might be the biggest obstacle for the business. Additionally, it is advised that staff receive big dataset training or certification and that the company dataset be justified by big data experts at the start of data analysis in order to prevent problems with data quality.
3. Data analysis and commentary
3.1 comparison of sales value during the year, month, and whole analysis period
From the clustered bar chart below, the results of sales values during 2018, 2019 and 2020 can be understood. As, In May 2020, BIJ made an investment in a marketing initiative in the United Kingdom, so it is necessary to observe and compare the previous year results including results till April 2020 and results from May 2020 to December 2020. Prior to discounts, refunds, and allowances, the business’s total revenue is referred to as its “sales value.” Debit cards, cash, credit cards, and trade credit will all be accepted as forms of payment for the sales. Total units sold times the price per unit sold is how sales typically determined (Syarif et al., 2022).
The information regarding the sales values are shown below and the graphical representation of those values over the years i.e., 2018, 2019 and 2020, both before the start of marketing campaign and after the start of the marketing campaign are shown in figure 1. In the figure 1 the blue bar represents sales value of 2018, following it the orange bar represents 2019 and 2020 is represented by the grey bar. It can be observed that, after initialization of the marketing campaign, it can be observed that the sales value of the Bangles and International Jewellery were highest when compared to the previous year results, but in December the sales value dropped to the lowest point when compared to the same month of previous 2 years. The absurd fall in the sales value is a reason of concern for Bangles and International Jewellery.
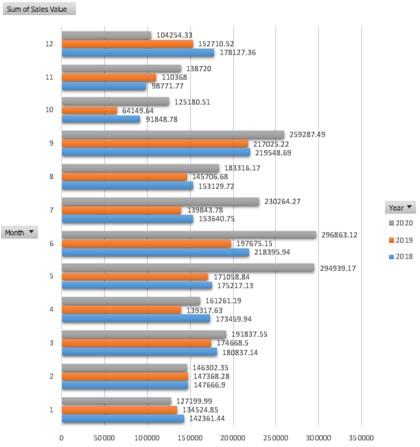
Figure 1: Clustered Bar Chart showing the Sales Value of Bangles and International Jewellery in 2018, 2019 and 2020
The figure 2 shows the overall trend in the sales value, that is the sum of sales value for 2018, 19 and 20 shown differently. It can be seen from the figure that the overall sum value of sales stayed above every other year all along from the start to end, till December. From month 5 i.e., from May the value of sales kept decreasing till August and in September it again rose up and following it took a slump October and rose in a very little amount in November. In December, the sales value was the lowest among all three years taken under consideration.
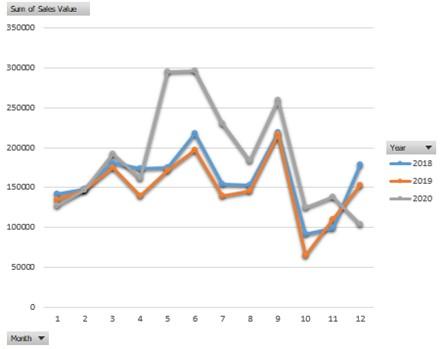
Figure 2: Line Chart of Sum of Sales Value for years 2018, 2019 and 2020
3.2 Comparison of sales volume during the year, month, and whole analysis period
The Figure 3 below, shows the sum of sales volume for Bangles and International Jewellery. The sum of components the business vends over the development of a definite commentary period is denoted as volume of sales. Conditional on the size of bulk the analyst is trying to examine, this time frame may be a monthly, a quarterly, or a year. When determining whether a firm is expanding or decreasing, investors usually consider sales volume. It is difficult to predict earnings or net sales based just on sales volume. The entire revenue calculation would need to be applied in such case. However, a lot of the team’s sales decisions might still be influenced by sales volume. It’s a fantastic tool for assisting with sales forecasting, informing sales statistics, and understanding sales indicators in relation to consumer choice (Patel et al., 2020). Here the grey bar is representing the figures of 2020 in terms of sales volume. While the orange and blue coloured bars are showing 2019 and 2018 respectively. From May 2020, it can be observed that, the sum of sales volume has been increased and that too with significant jump. In the following month the sales volume went a little more and then in July, it dropped down below the sales volume of March. In August, another decrease was observed, following it a negligible increase in September. Again the sales volume dropped significantly in October and showed a negligible lift in November. In the final month, the sales of 2020 was the lowest when all 3 years are taken into consideration.
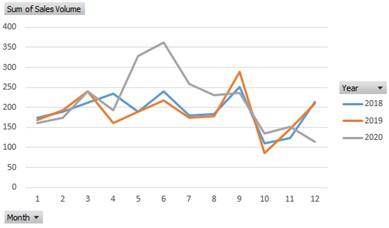
Figure 3: Clustered Column Chart showing the Sales Volume of Bangles and International Jewellery in 2018, 2019 and 2020
The sum of sales volume is graphically represented by a line chart in the figure 4. From the line chart below, it is well understood that from May to June, the Sum value of the sales volume increased. Again, it decreased in July and again it decreased in August and further down it was stagnant almost till September and dropped in number in October. In November the sum of sales volume rose very insignificantly and again dropped showing the lowest number of sales volume over the 3 years.
Figure 4: Line Chart of Sum of Sales Volume for years 2018, 2019 and 2020
3.3 T test of Sales Volume and Sales Value taking unequal variances
When there is a notable alteration comparing the average of 2 categories and the way they are connected, a T-test is indeed an inference measure that may be calculated to display it. T-tests are used for data sets that have a normal distribution and unknown variances, as the one produced by the coin being tossed 100 times. Two data sets are compared based on their average values to see if they represent the same population using a t-test (Gerald, 2018). The average and standard deviation of a population of student from A Section in the illustrations overhead and a subset of students with B class are most likely different. In figure 5, the T test table shows a large number of statistical measures. The mean or average of the variables are present along with the variances. The T stat, T Critical value and the P value two tailed can be observed in the T test table. The threshold for accepting or disproving the null hypothesis is the T critical value. The null hypothesis usually disregarded every time the T statistic is grander than its T critical value away from 0, but not always. The P two tailed value resulted to be 2.21334E-19 i.e., 0.000000000000000000221334 in number. The test was conducted taking confidence level at 95% that means the alpha value is 0.05 so, the P value is fewer than that and it implies that the null hypothesis is rejected and hence there exists a relationship between sales volume and sales value.
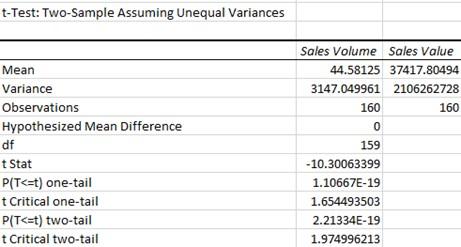
Figure 5: T Test of Sales Volume and Sales Value taking unequal variances
Task 4. Conclusions and recommendations
The study’s suggestion summarized the establishment’s economic figures. The worldwide jewellery industrialist BIJ directly represents metric KPIs that gauge its significant worth across a whole monetary year. The business could produce an indication as a statistic to keep track of and highlight the disparities. It will be challenging for the company to boost sales if indeed the KPI is also not employed. A KPI would aid the enterprise in sustaining its excellence ideals. After a fiscal year, the business also be able to evaluate how factual performance compares to past values (Ghannouchi et al., 2019).
Email advertising is a different strategy to attract customers to the company’s products and other viewpoints. By utilising social networking sites, the sector will soon be able to get additional consumer data through social media channels. The company may routinely contact its potential customers after gathering individuals’ email addresses from various web-based social networking platforms. By constantly sending out the entire deal’s details through email, the company may promote exceptional offers and other savings. Customers must engage in more interactions in order to stay current with the products. It is rare to find such a straightforward business concept as this one (Seth et al., 2019).
The present state of everyone’s troubles or online activity is one of intense business. Therefore, a company needs to think about that behaviour from the client’s point of view. Social media will make it easier to elicit more positive feedback from customers. On numerous social media platforms, people buy a sizable quantity of time. On social networking sites, the company may draw potential buyers to its many jewellery goods and display a range of its upcoming advancements. Consequently, there would be a higher likelihood of success in making a profit. Informing potential customers about various offers may also be done through internet messaging. The marketing department is therefore required to promote social advertisements in order to build its brand (Nyagadza et al., (2022).
A number of other nations are where British jewellery company BIJ sells their products. Nevertheless, it does not necessarily entirely pertain to the jewellery sector. Affiliate marketing is another method a company can use to boost sales. In order to increase brand identification among diverse audience segments and attract more customers, a firm may utilise personalities in its web advertising. An economic argument is additional revolutionary instrument the corporation may go with to explore and boost profits by overriding financial facts. Future income estimates might result from the application of this novel method. A firm should take a number of economic elements into effect, such as the rate of inflation, corporate objectives, development with additional aspects, whilst also forecasting likely expenditures (Pattnaik et al., 2020).
5. References
Aggarwal, R., Jindal, V. and Seth, R., (2019). Board diversity and firm performance: The role of business group affiliation. International Business Review, 28(6), p.101600.
Apriyanti, R. and Syarif, M.A., (2022). The Influence of Price and Promotion on Sales Volume of BumDes Shelter House Business in Sungai Rebo Village. Budapest International Research and Critics Institute-Journal (BIRCI-Journal), 5(3).
Chawla, Y. and Chodak, G., (2021). Social media marketing for businesses: Organic promotions of web-links on Facebook. Journal of Business Research, 135, pp.49-65.
Donthu, N., Kumar, S. and Pattnaik, D., (2020). Forty-five years of Journal of Business Research: A bibliometric analysis. Journal of business research, 109, pp.1-14.
Eggert, A., Ulaga, W., Frow, P. and Payne, A., (2018). Conceptualizing and communicating value in business markets: From value in exchange to value in use. Industrial Marketing Management, 69, pp.80-90.
Gerald, B., (2018). A brief review of independent, dependent and one sample t-test. International Journal of Applied Mathematics and Theoretical Physics, 4(2), pp.50-54.
Kumar, B. and Sharma, A., (2022). Examining the research on social media in business-to-business marketing with a focus on sales and the selling process. Industrial Marketing Management, 102, pp.122-140.
Nyagadza, B., (2022). Search engine marketing and social media marketing predictive trends. Journal of Digital Media & Policy.
Trivedi, S. and Patel, N., (2020). The Role of Automation and Artificial Intelligence in Increasing the Sales Volume: Evidence from M, S, and, MM Regressions. Trivedi, Sandeep and Patel, Nikhil, The Role of Automation and Artificial Intelligence in Increasing the Sales Volume: Evidence from M, S, and, MM Regressions (June 20, 2020).
Wannes, A. and Ghannouchi, S.A., (2019). KPI-based approach for business process improvement. Procedia Computer Science, 164, pp.265-270.